Domestic Supply and Production, Import & Export Quantities of Animal Products
By Good Food Data | Published at 2019-12-30 | Updated at 2019-12-30
Domestic supply of animal products and their production, import & export quantities
Trends of domestic supply
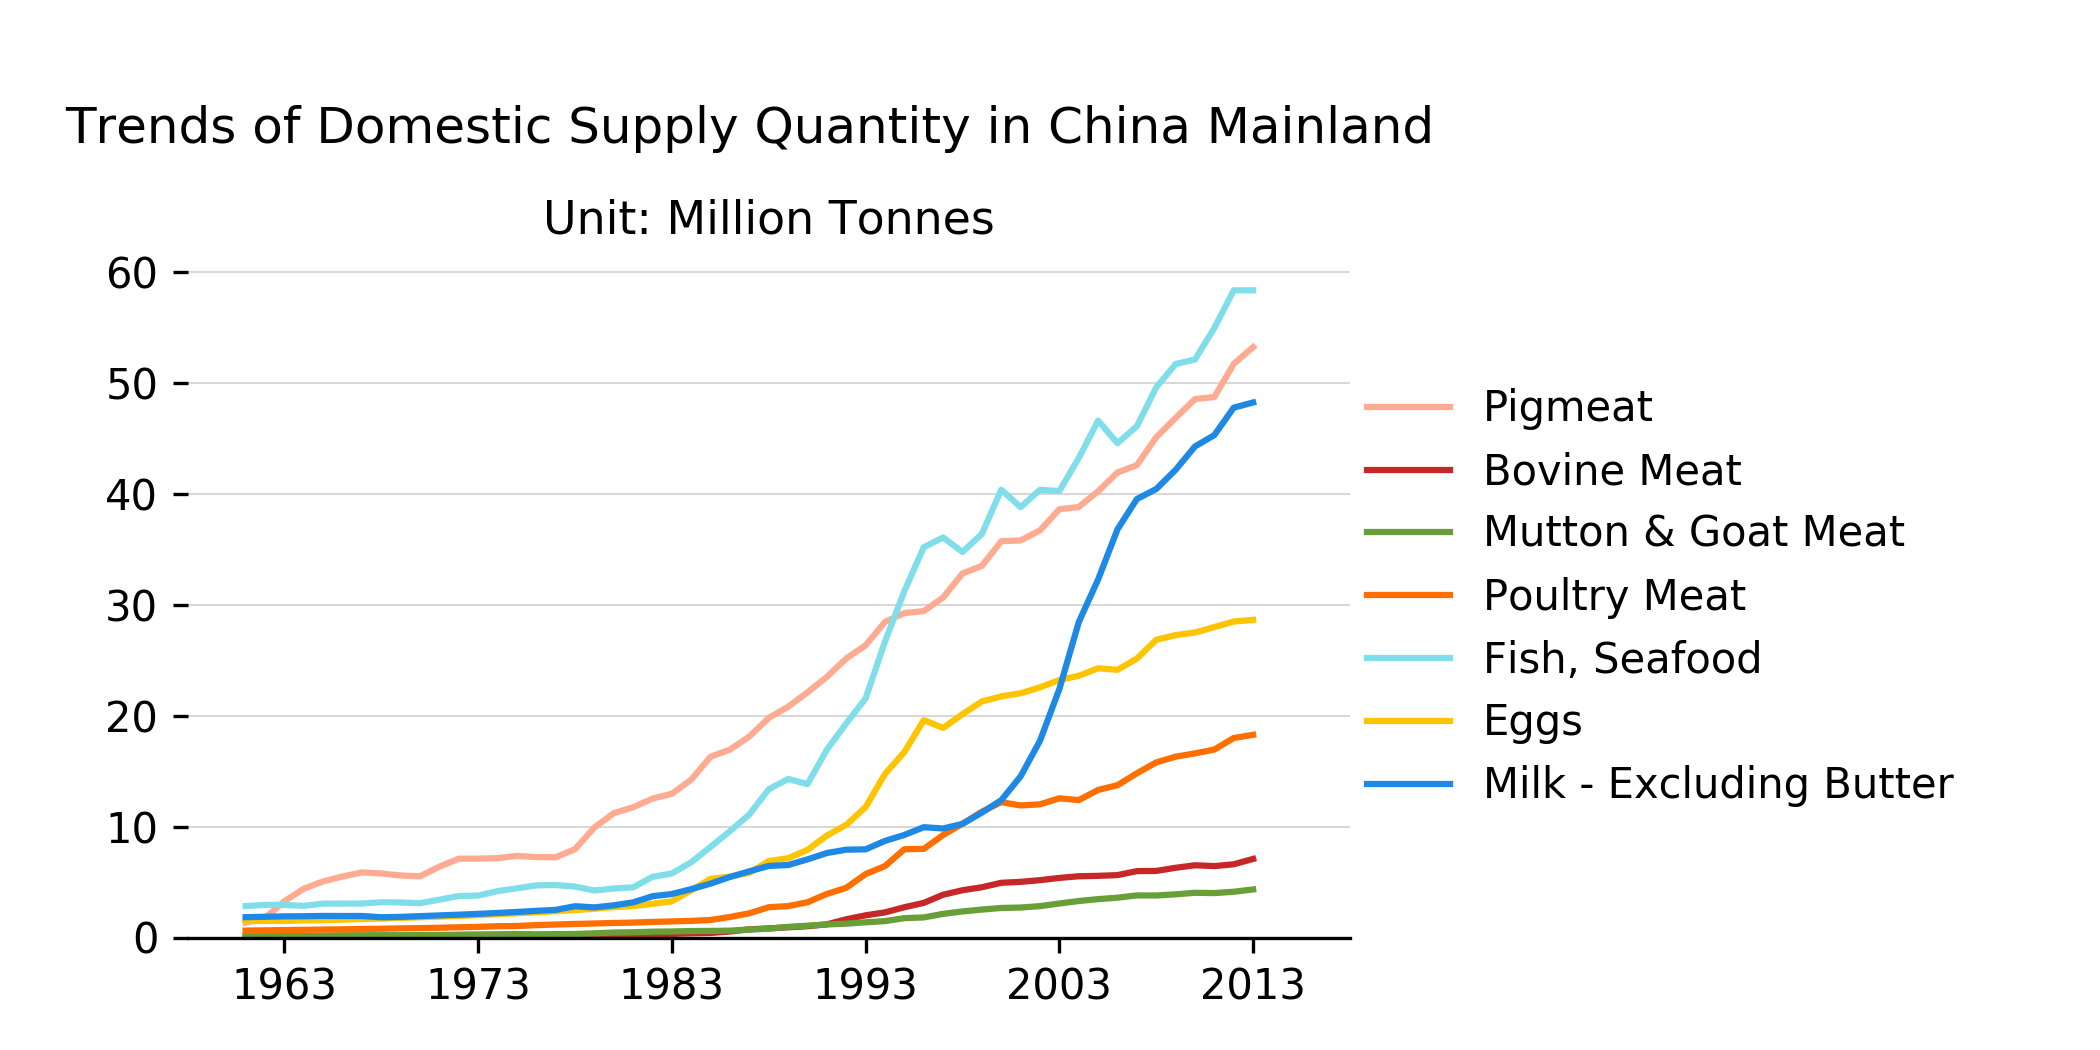
Fig 1.1.a |
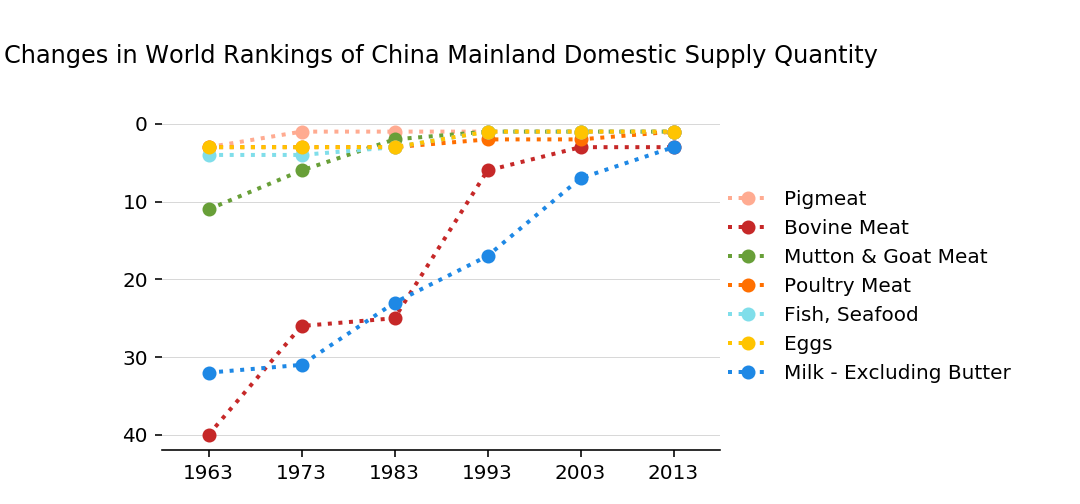
Fig 1.2.a |
Production, import & export quantities respectively
Pigmeat

Fig 1.3.a |
Bovine Meat

Fig 1.3.b |
Mutton & Goat Meat

Fig 1.4.c |
Poultry Meat

Fig 1.3.d |
Fish, Seafood

Fig 1.3.e |
Eggs

Fig 1.3.f |
Milk - Excluding Butter

Fig 1.3.g |
Production
Trends of production

Fig 2.1.a |

Fig 2.2.a |
World map of production
Pigmeat

Fig 2.3.a |

Fig 2.3.b |

Fig 2.3.c |
Bovine Meat

Fig 2.4.a |

Fig 2.4.b |

Fig 2.4.c |
Mutton & Goat Meat

Fig 2.5.a |

Fig 2.5.b |

Fig 2.5.c |
Poultry Meat

Fig 2.6.a |

Fig 2.6.b |

Fig 2.6.c |
Fish, Seafood

Fig 2.7.a |

Fig 2.7.b |

Fig 2.7.c |
Eggs

Fig 2.8.a |

Fig 2.8.b |

Fig 2.8.c |
Milk - Excluding Butter

Fig 2.9.a |

Fig 2.9.b |

Fig 2.9.c |
Compare China mainland with OECD

Fig 2.10.a |

Fig 2.10.b |

Fig 2.10.c |

Fig 2.10.d |

Fig 2.10.e |

Fig 2.10.f |

Fig 2.10.g |
Trends of some other areas

Fig 2.11.a |
North America

Fig 2.11.a |
Western Europe

Fig 2.11.b |
Australia & New Zealand

Fig 2.11.c |
South-Eastern Asia

Fig 2.11.d |
Japan

Fig 2.11.e |
Republic Of Korea

Fig 2.11.f |
Import quantity
Trends of import quantity

Fig 3.1.a |

Fig 3.2.a |
World map of import quantity
Pigmeat

Fig 3.3.a |

Fig 3.3.b |

Fig 3.3.c |
Bovine Meat

Fig 3.4.a |

Fig 3.4.b |

Fig 3.4.c |
Mutton & Goat Meat

Fig 3.5.a |

Fig 3.5.b |

Fig 3.5.c |
Poultry Meat

Fig 3.6.a |

Fig 3.6.b |

Fig 3.6.c |
Fish, Seafood

Fig 3.7.a |

Fig 3.7.b |

Fig 3.7.c |
Eggs

Fig 3.8.a |

Fig 3.8.b |

Fig 3.8.c |
Milk - Excluding Butter

Fig 3.9.a |

Fig 3.9.b |

Fig 3.9.c |
Compare China mainland with OECD

Fig 3.10.a |
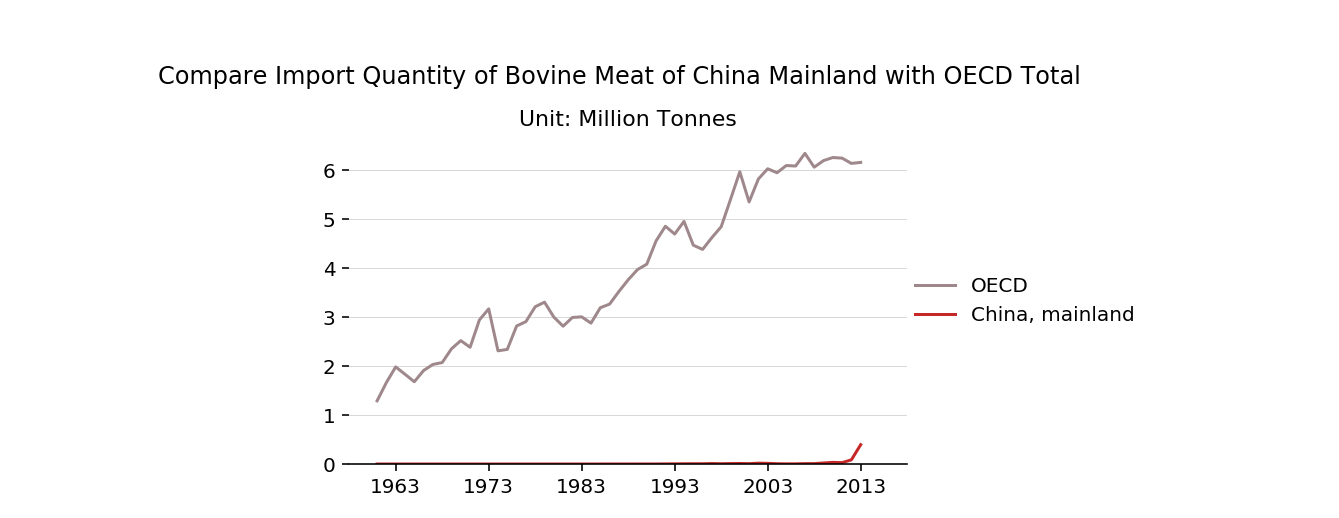
Fig 3.10.b |

Fig 3.10.c |

Fig 3.10.d |

Fig 3.10.e |
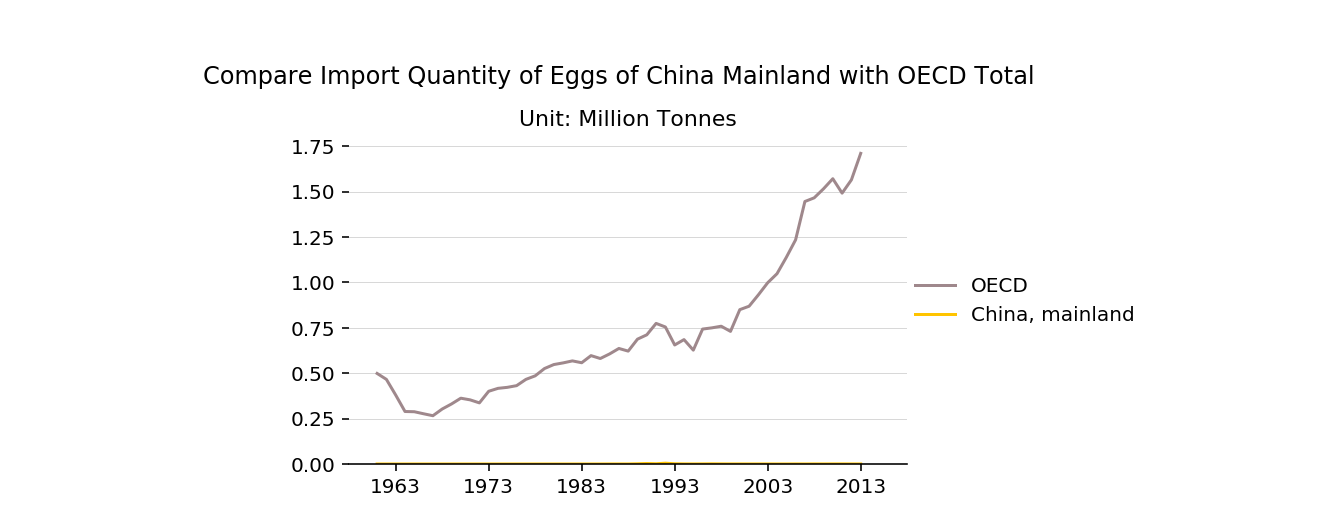
Fig 3.10.f |

Fig 3.10.g |
Trends of some other areas
North America

Fig 3.11.a |
Western Europe
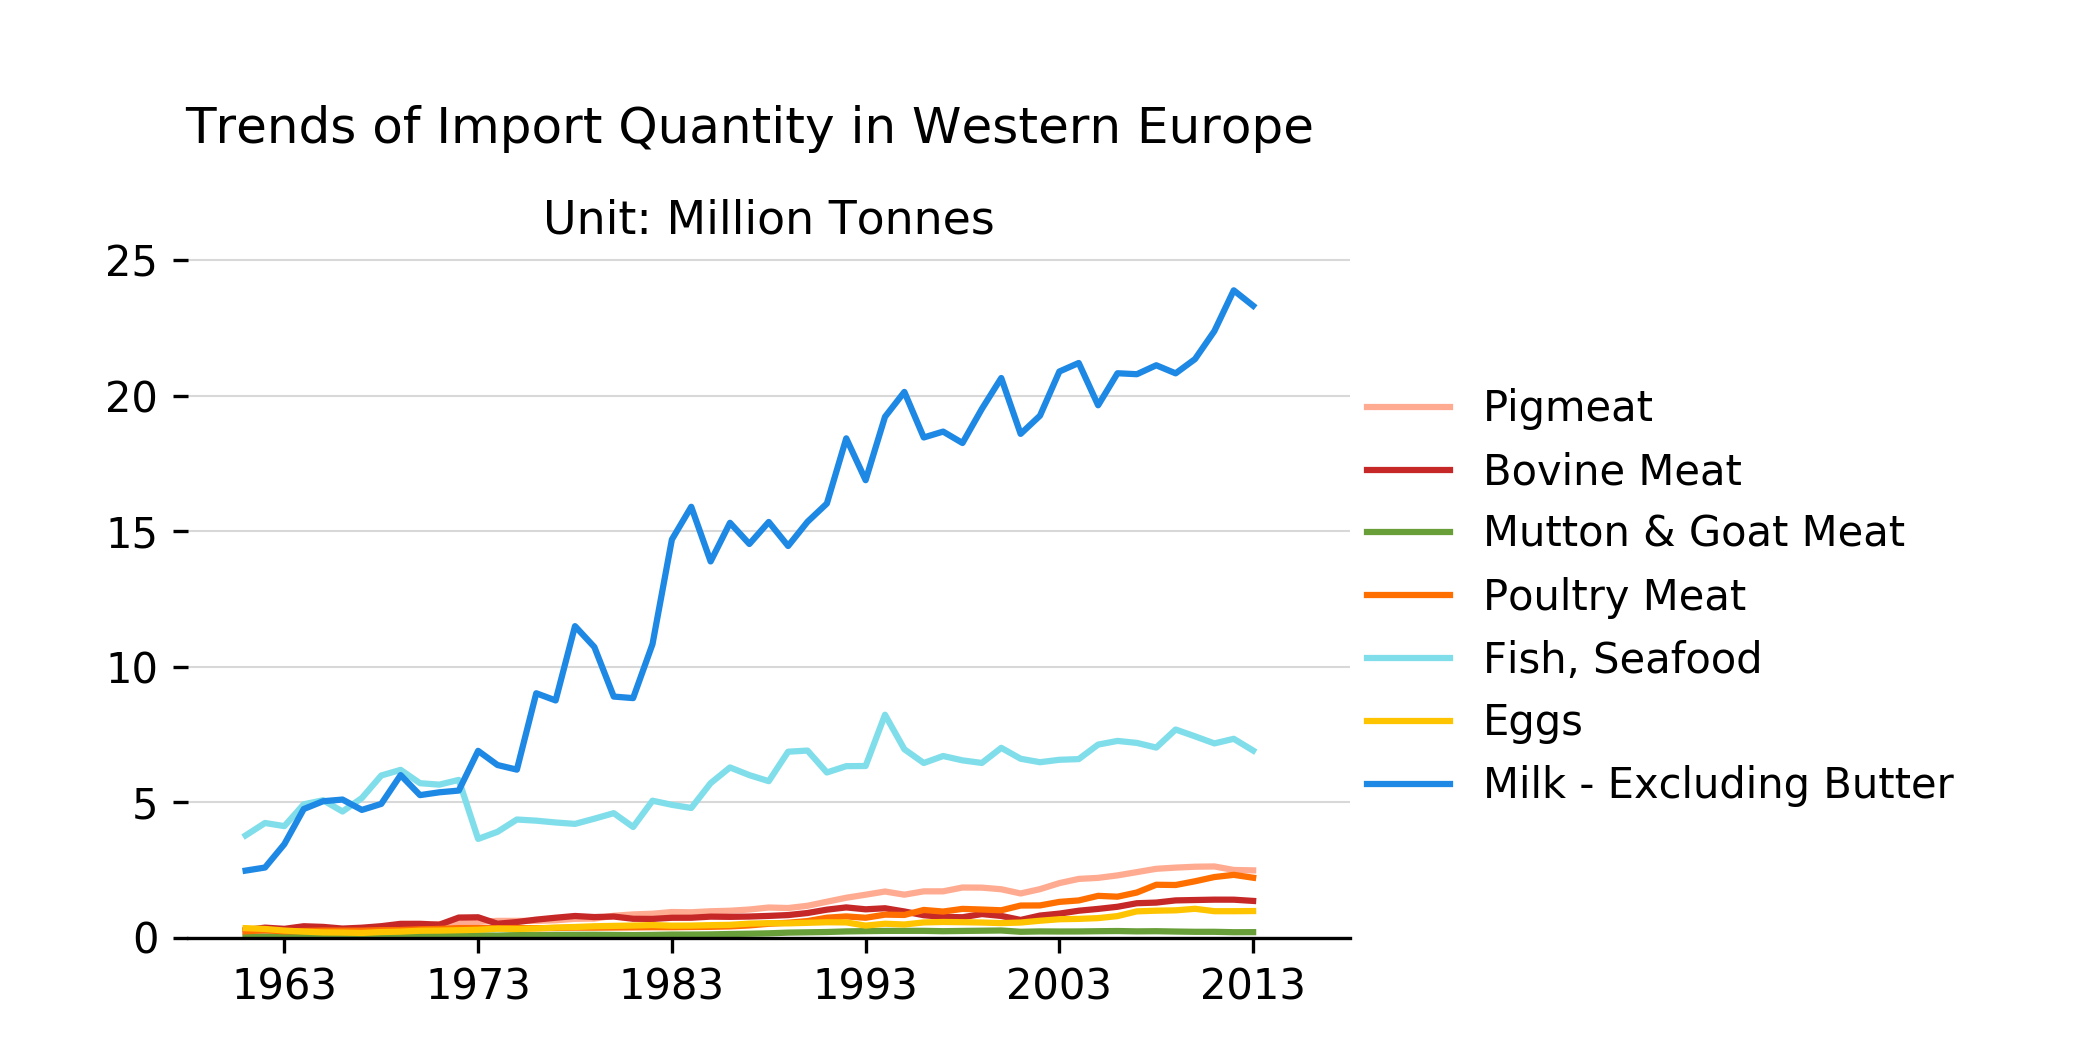
Fig 3.11.b |
Australia & New Zealand

Fig 3.11.c |
South-Eastern Asia

Fig 3.11.d |
Japan
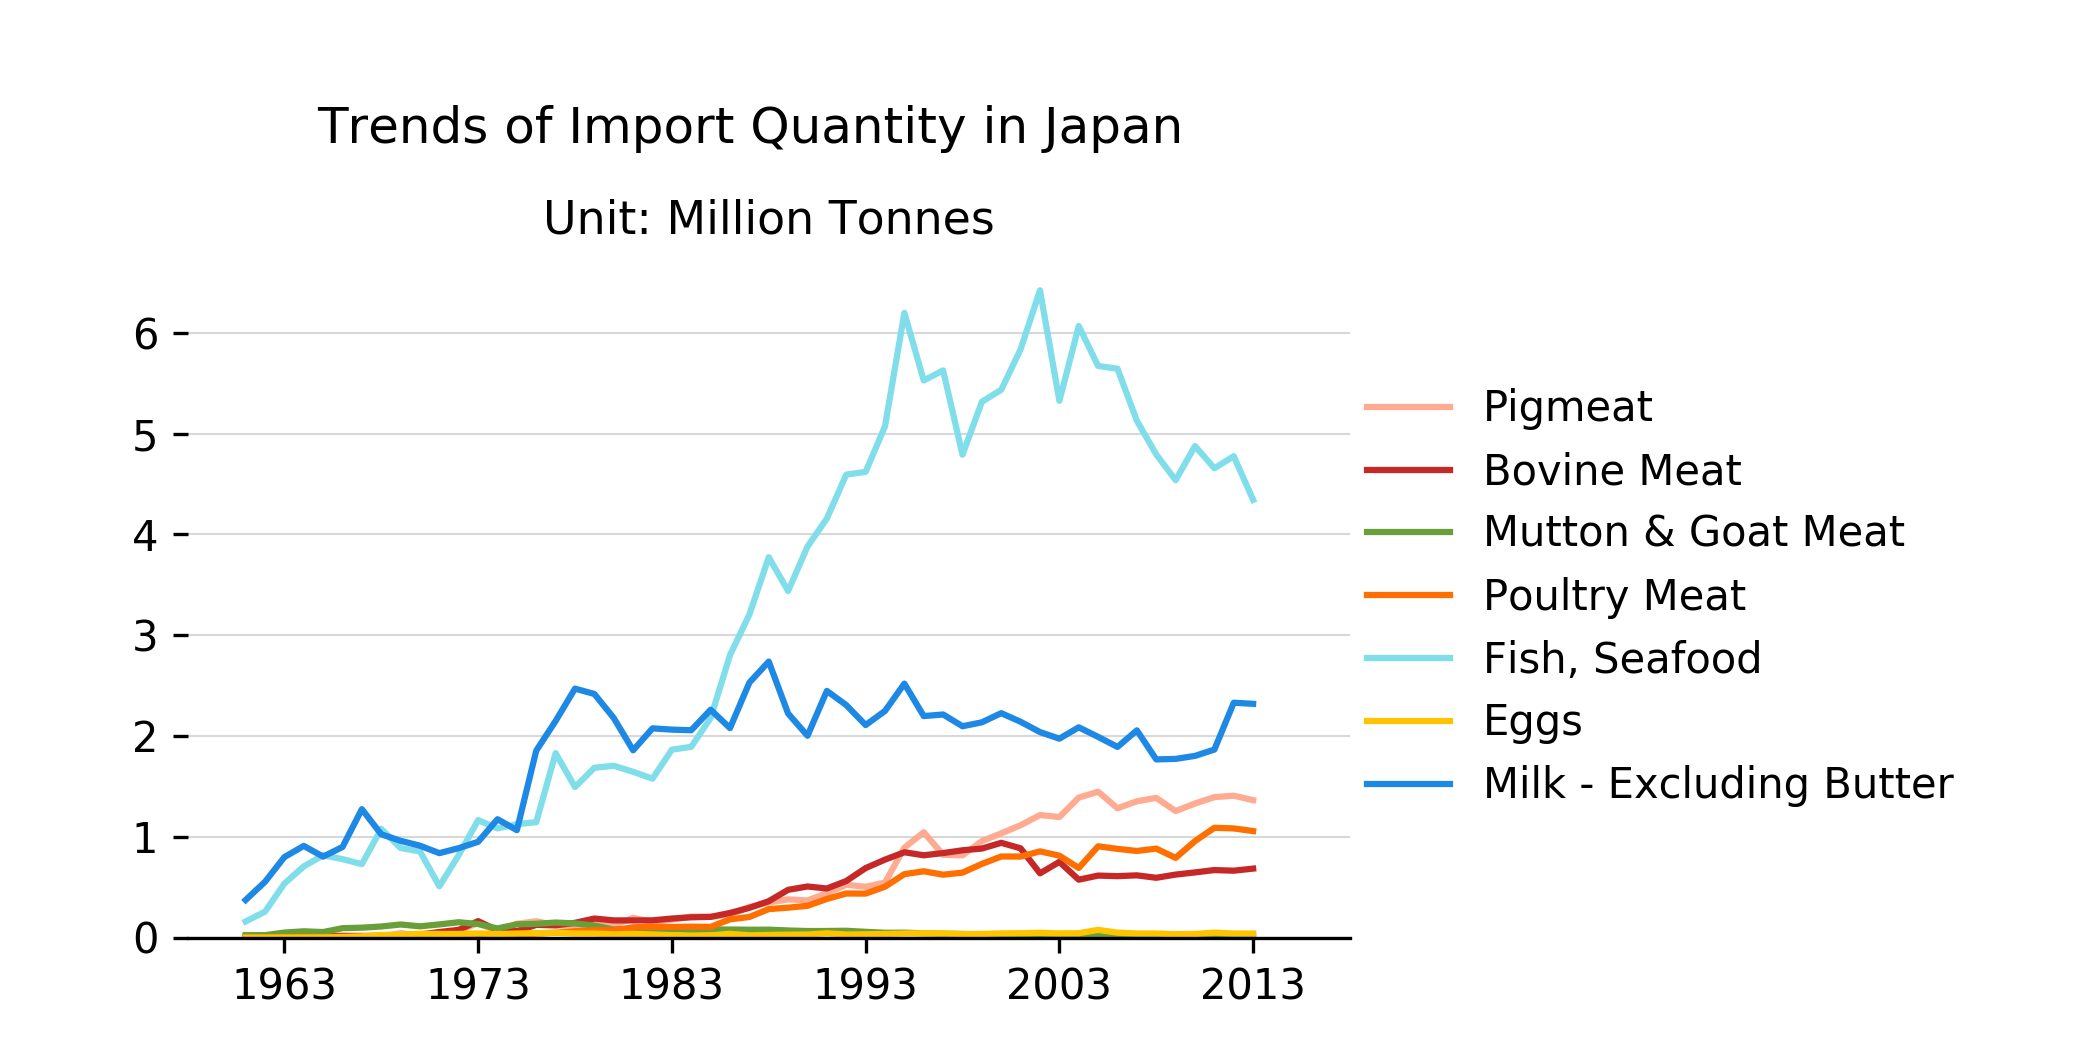
Fig 3.11.e |
Republic Of Korea

Fig 3.11.f |
Export quantity
Trends of export quantity

Fig 4.1.a |

Fig 4.2.a |
World map of export quantity
Pigmeat

Fig 4.3.a |

Fig 4.3.b |

Fig 4.3.c |
Bovine Meat

Fig 4.4.a |

Fig 4.4.b |

Fig 4.4.c |
Mutton & Goat Meat

Fig 4.5.a |

Fig 4.5.b |

Fig 4.5.c |
Poultry Meat

Fig 4.6.a |

Fig 4.6.b |

Fig 4.6.c |
Fish, Seafood

Fig 4.7.a |

Fig 4.7.b |

Fig 4.7.c |
Eggs

Fig 4.8.a |

Fig 4.8.b |

Fig 4.8.c |
Milk - Excluding Butter

Fig 4.9.a |

Fig 4.9.b |

Fig 4.9.c |
Compare China mainland with OECD

Fig 4.10.a |
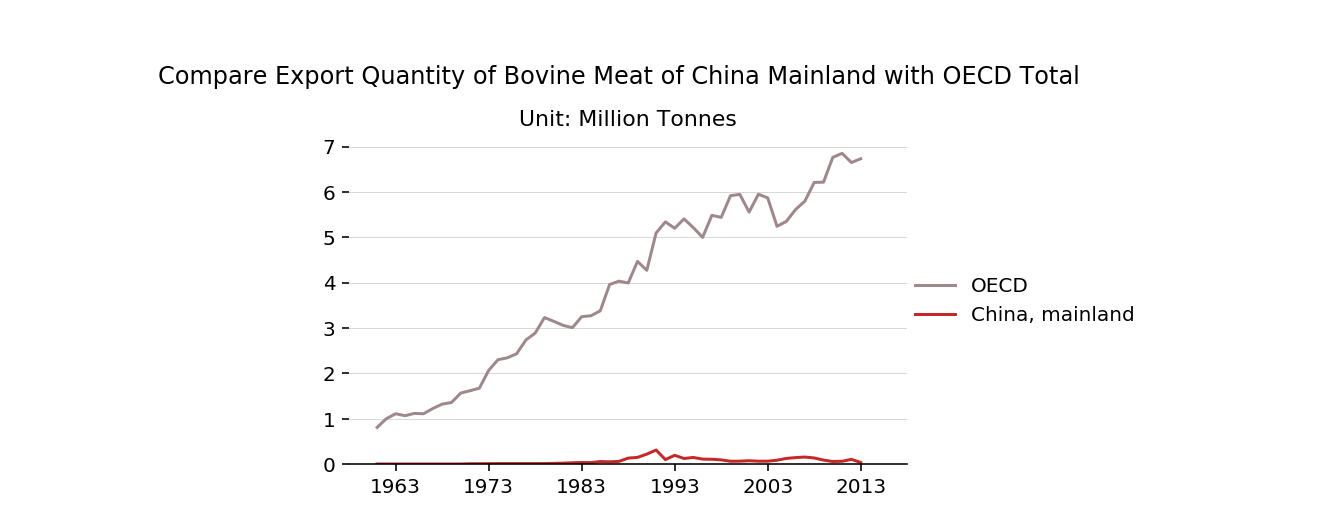
Fig 4.10.b |

Fig 4.10.c |
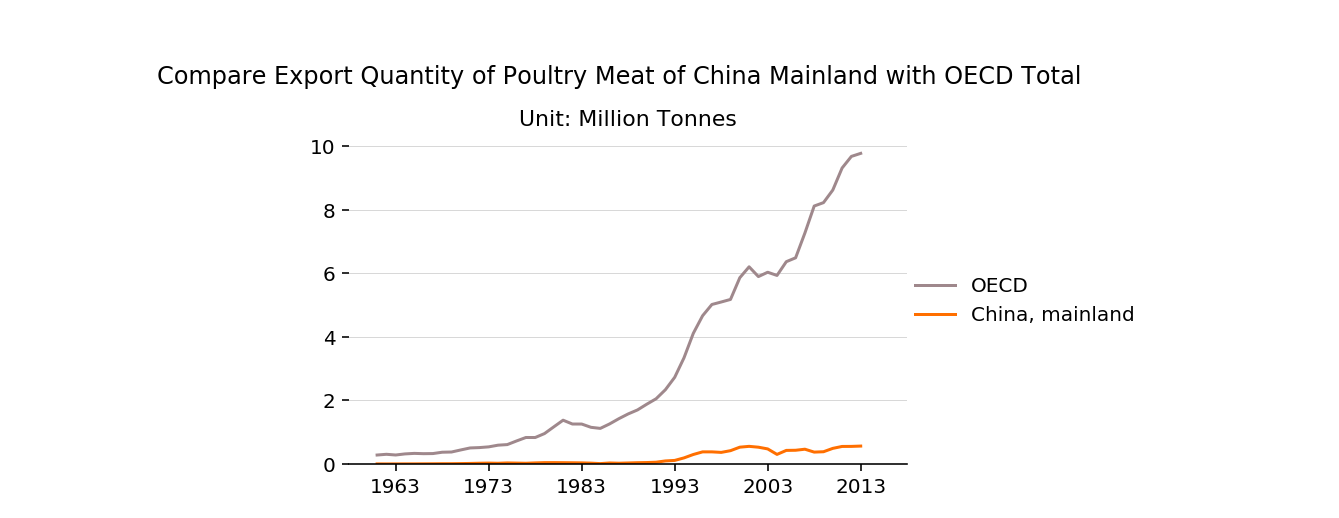
Fig 4.10.d |

Fig 4.10.e |

Fig 4.10.f |
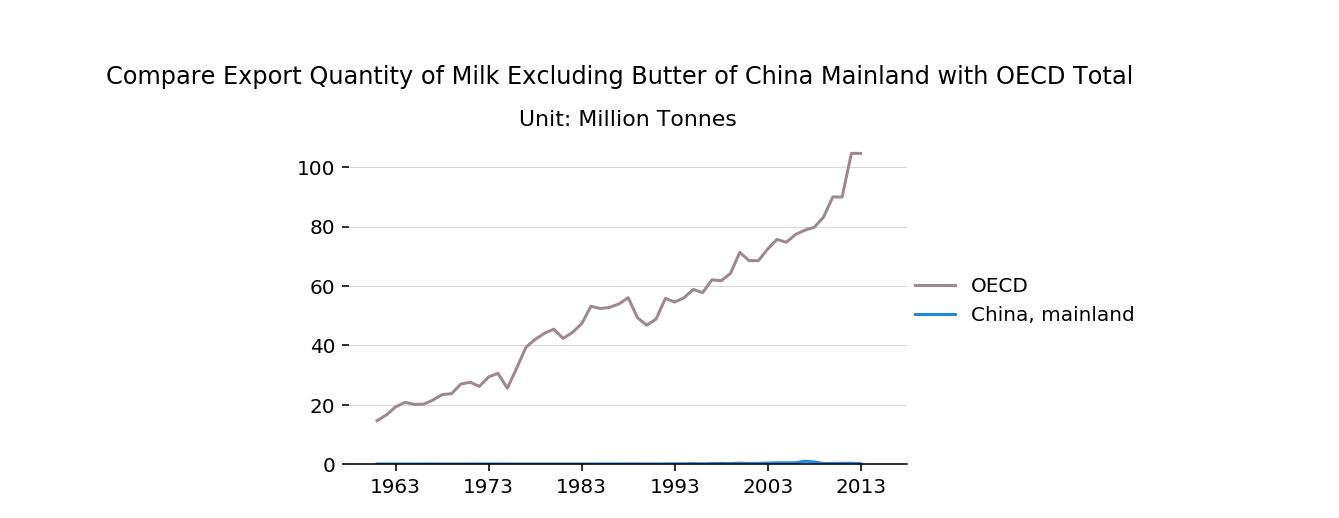
Fig 4.10.g |
Trends of some other areas
North America

Fig 4.11.a |
Western Europe
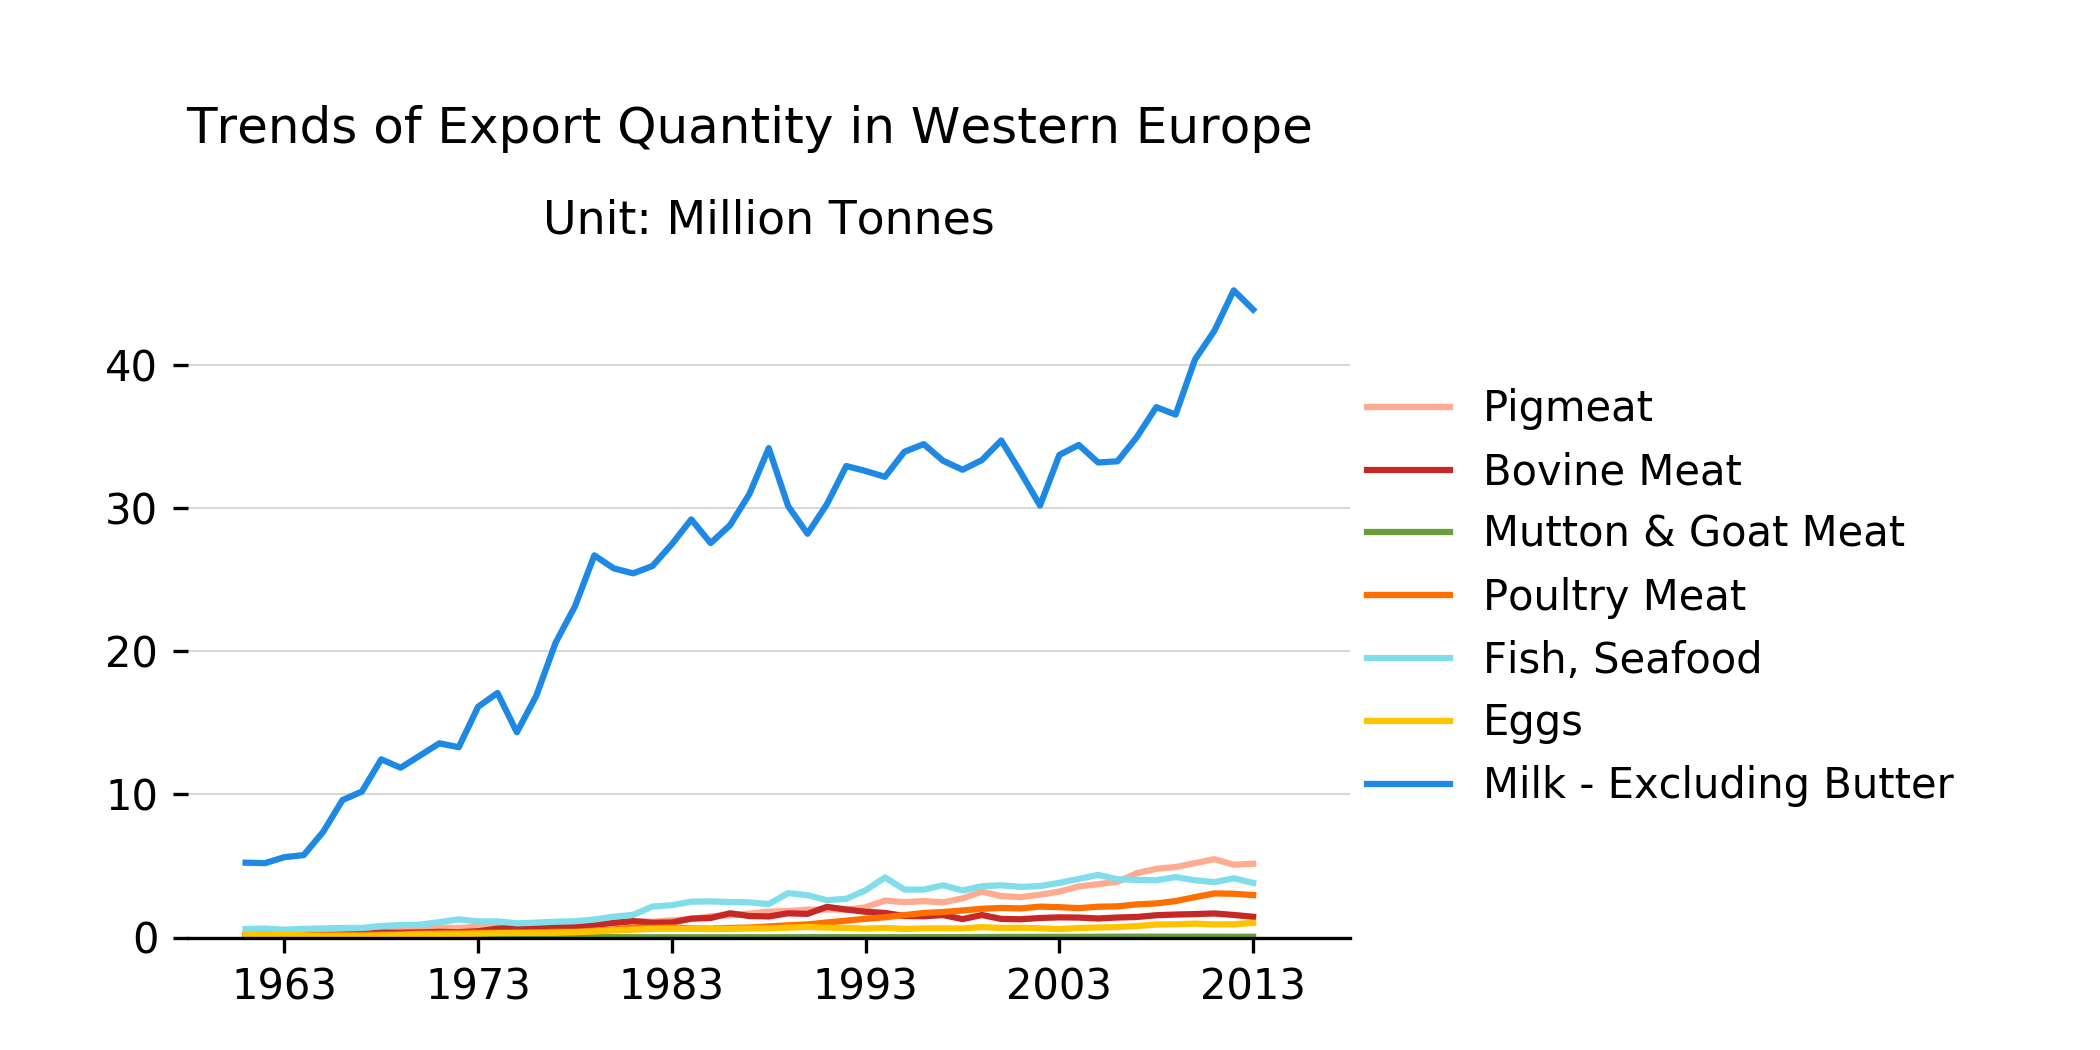
Fig 4.11.b |
Australia & New Zealand

Fig 4.11.c |
South-Eastern Asia

Fig 4.11.d |
Japan
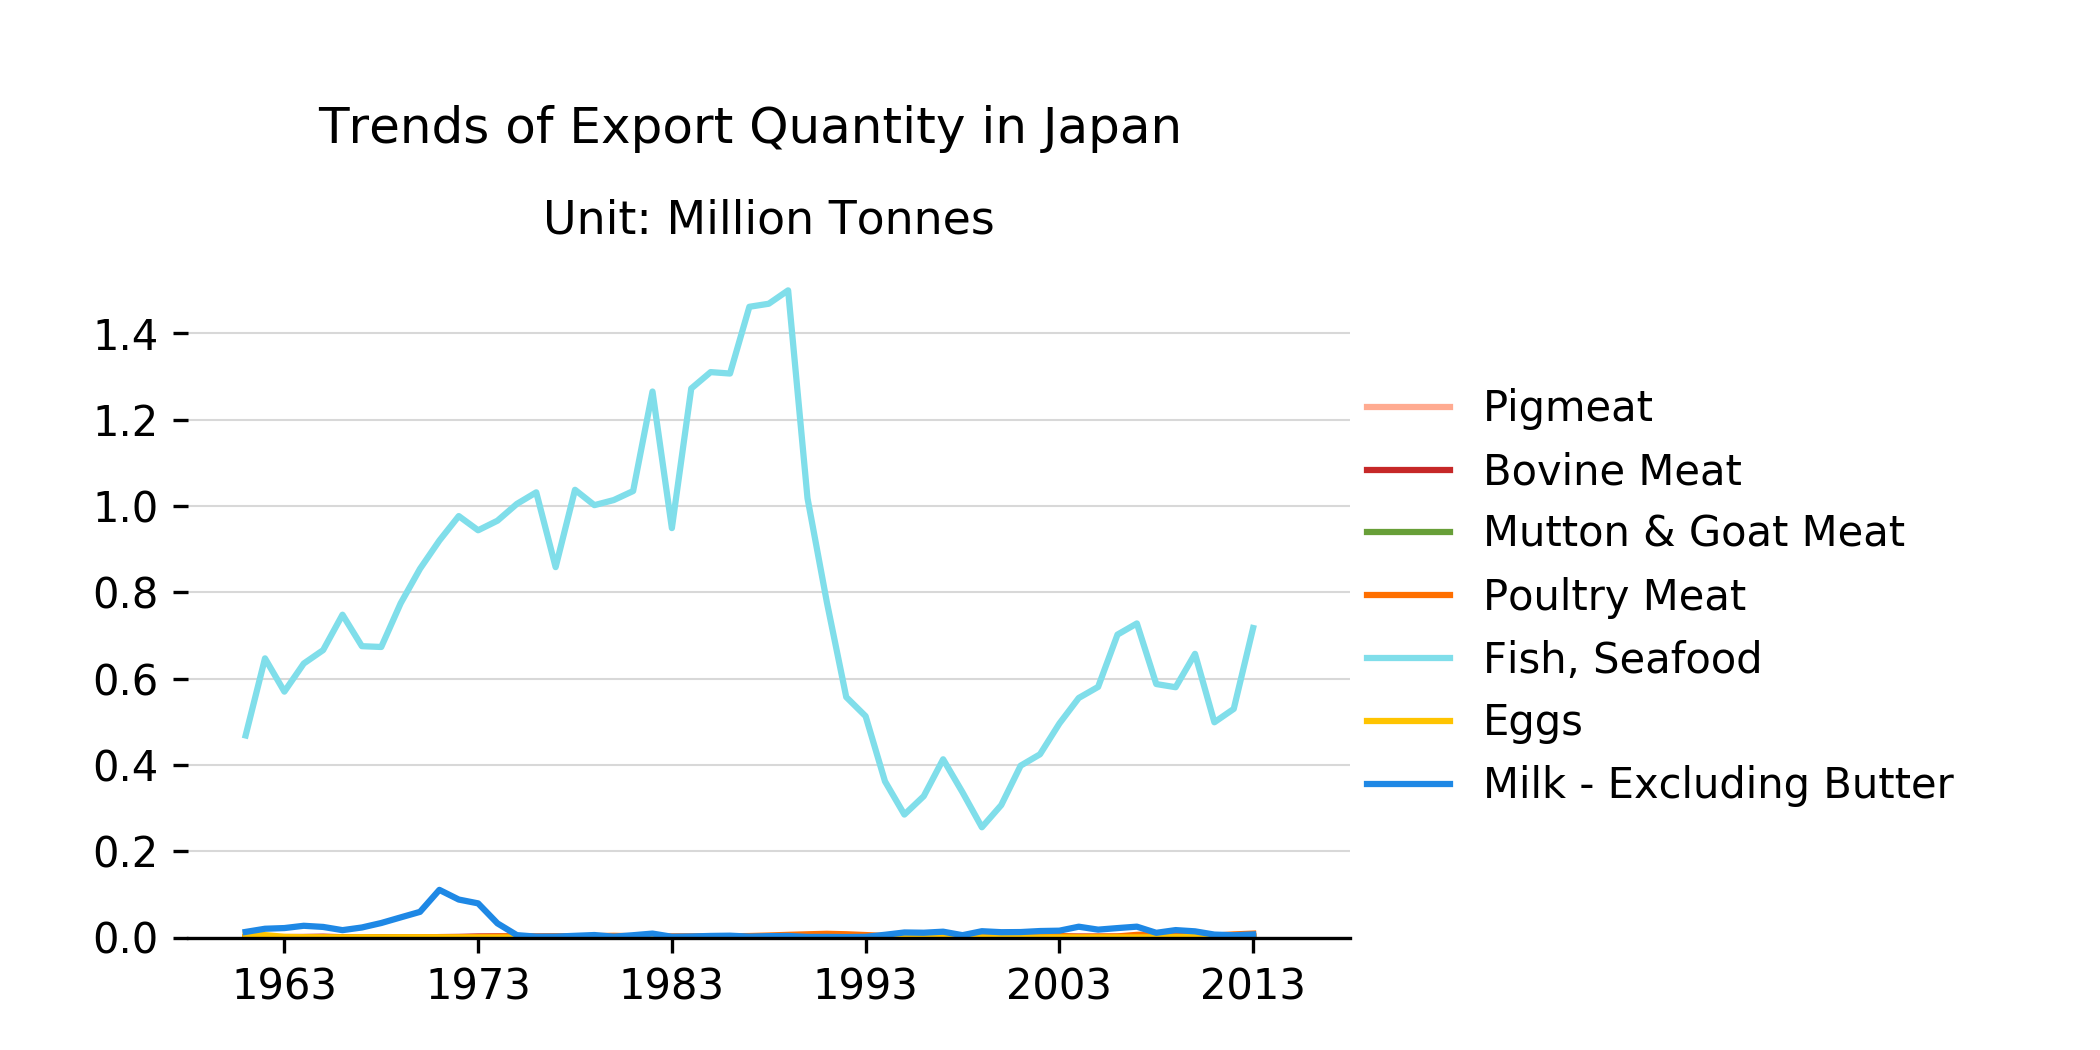
Fig 4.11.e |
Republic Of Korea

Fig 4.11.f |