Meat Atlas of China Mainland - Domestic Production of Animal Products
By Good Food Data | Published at 2019-12-14 | Updated at 2019-12-16
Production trends of animal products in China mainland
-line.png)
Fig 1.1.a |
-bar.png)
Fig 1.1.b |
 of Outputs of Animal Produced Food in China (mainland).png)
Fig 1.1.c |
The production in different areas and percentages in China mainland
.png)
Fig 2.1.a |
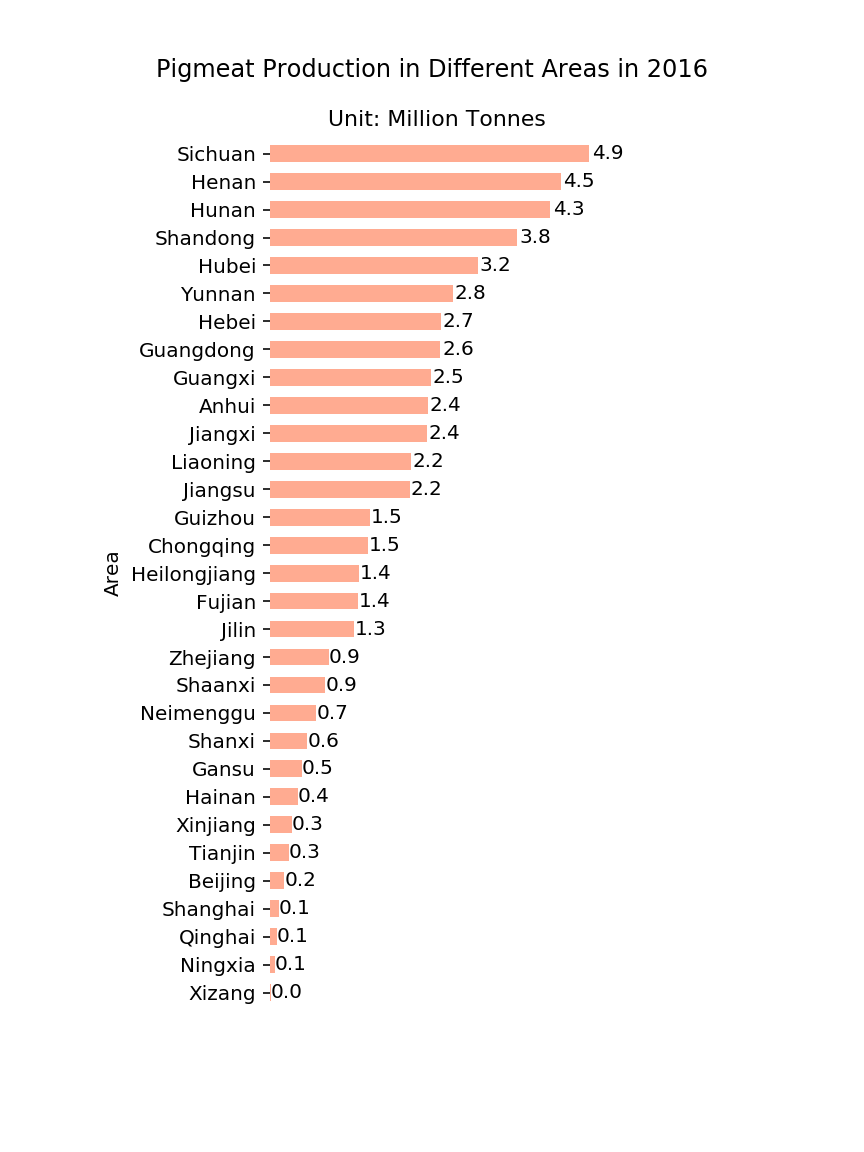
Fig 2.1.b |

Fig 2.1.c |
.png)
Fig 2.2.a |

Fig 2.2.b |

Fig 2.2.c |
.png)
Fig 2.3.a |
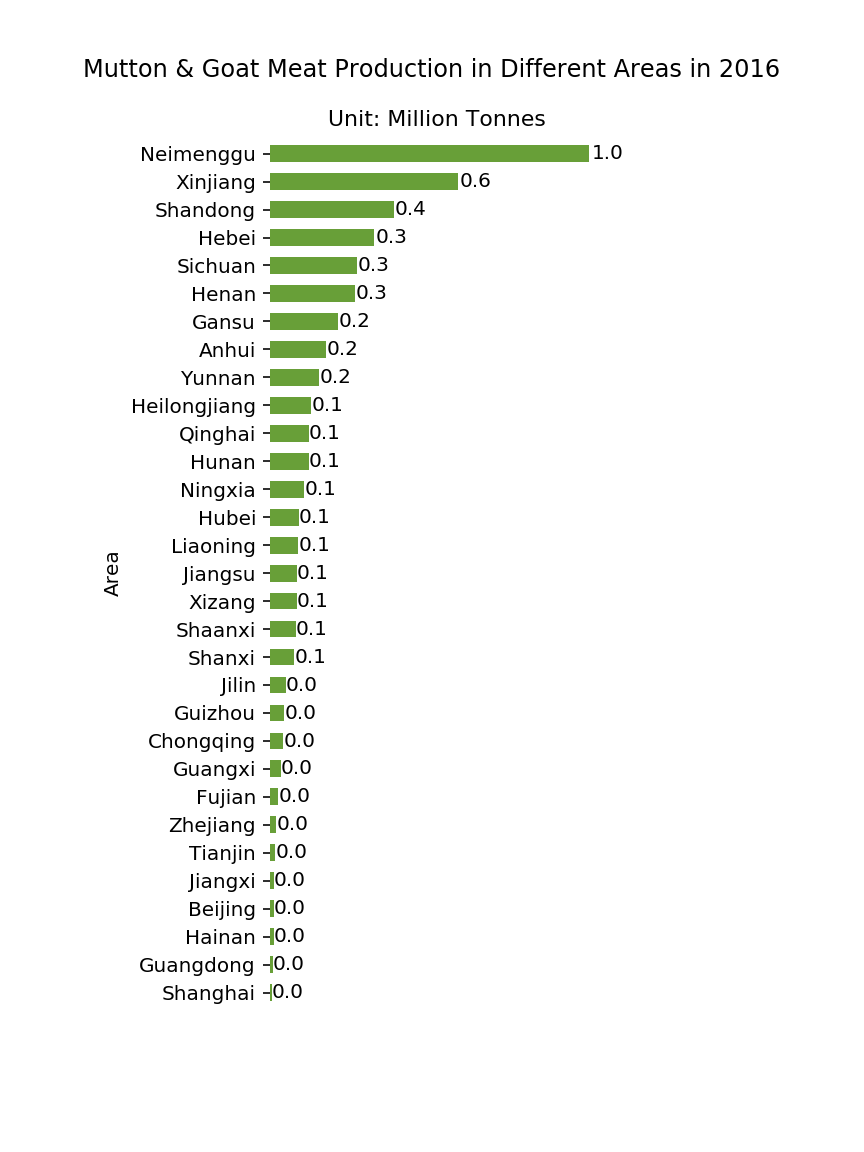
Fig 2.3.b |

Fig 2.3.c |
.png)
Fig 2.4.a |

Fig 2.4.b |

Fig 2.4.c |
.png)
Fig 2.5.a |

Fig 2.5.b |

Fig 2.5.c |
.png)
Fig 2.6.a |

Fig 2.6.b |

Fig 2.6.c |
.png)
Fig 2.7.a |
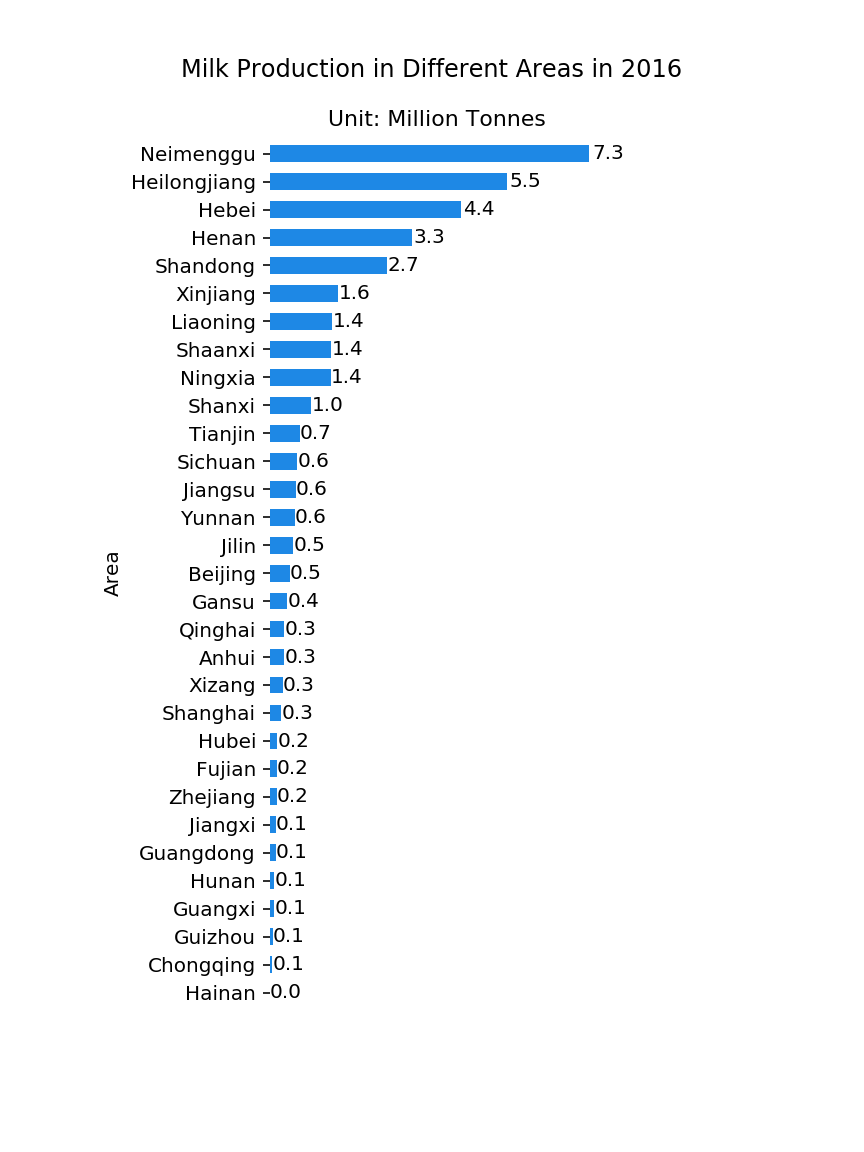
Fig 2.7.b |

Fig 2.7.c |
Main indicators of animal productivity
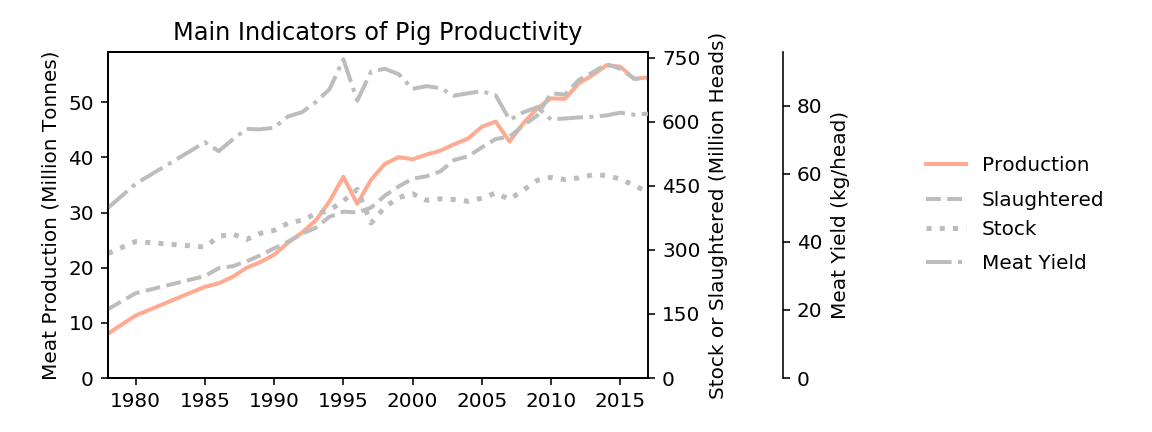
Fig 3.1 |
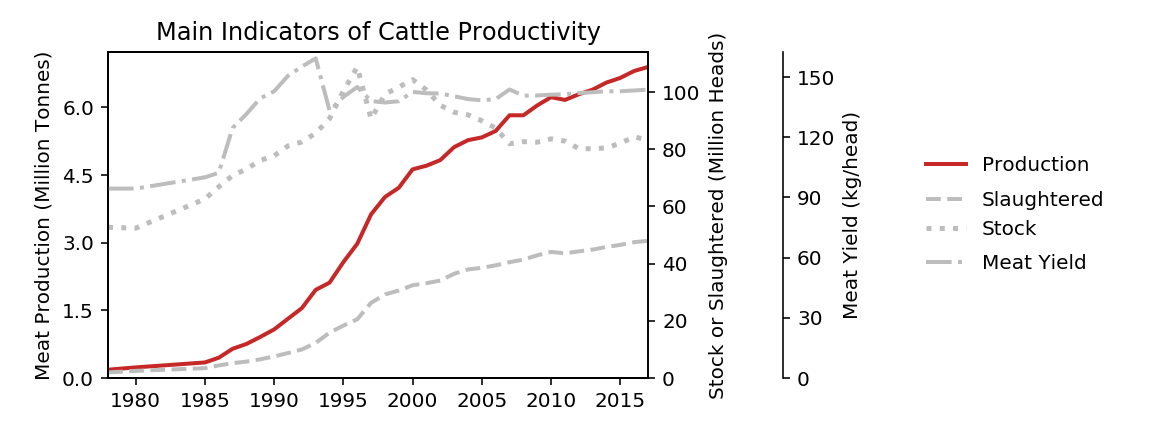
Fig 3.2 |
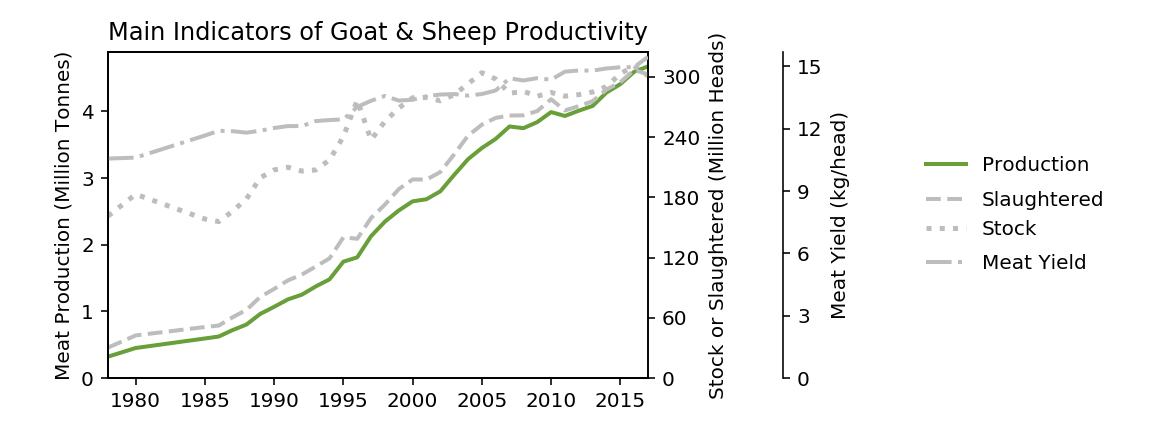
Fig 3.3 |

Fig 3.4 |
Captured and aquacultured aquatic production

Fig 4.1.a |

Fig 4.1.b |
 of Captured and Aquacultured Aquatic in China (mainland).png)
Fig 4.1.c |